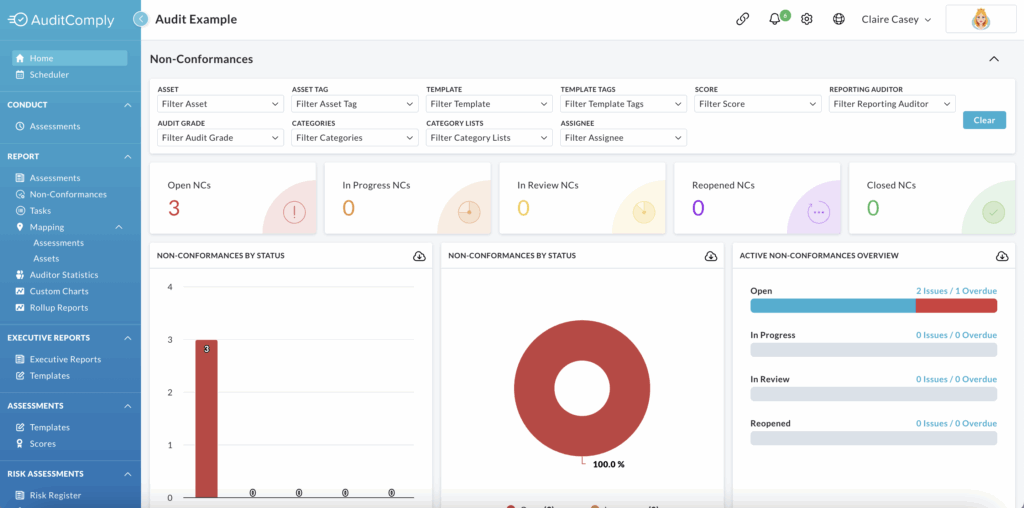
This section focuses specifically on non-conformances identified within the selected date range on your dashboard.
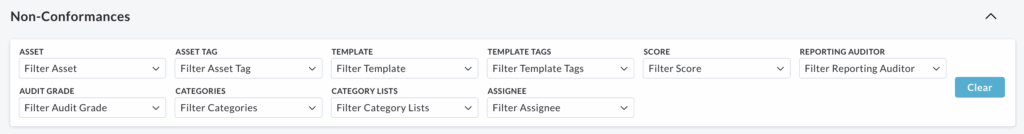
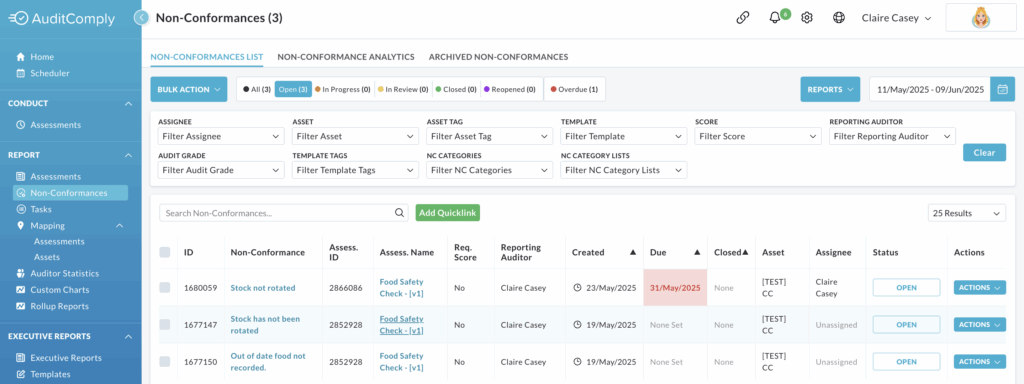
Non-Conformance Filters
You can refine the displayed information further by using the available filters.
To reset all filters and return to the default settings, click Clear.
Non-Conformance Charts
Below the filters, you will find a summary of the selected non-conformance data.
Click on each section of the summary to view more detailed information.

There are various charts to visualise non-conformance data:
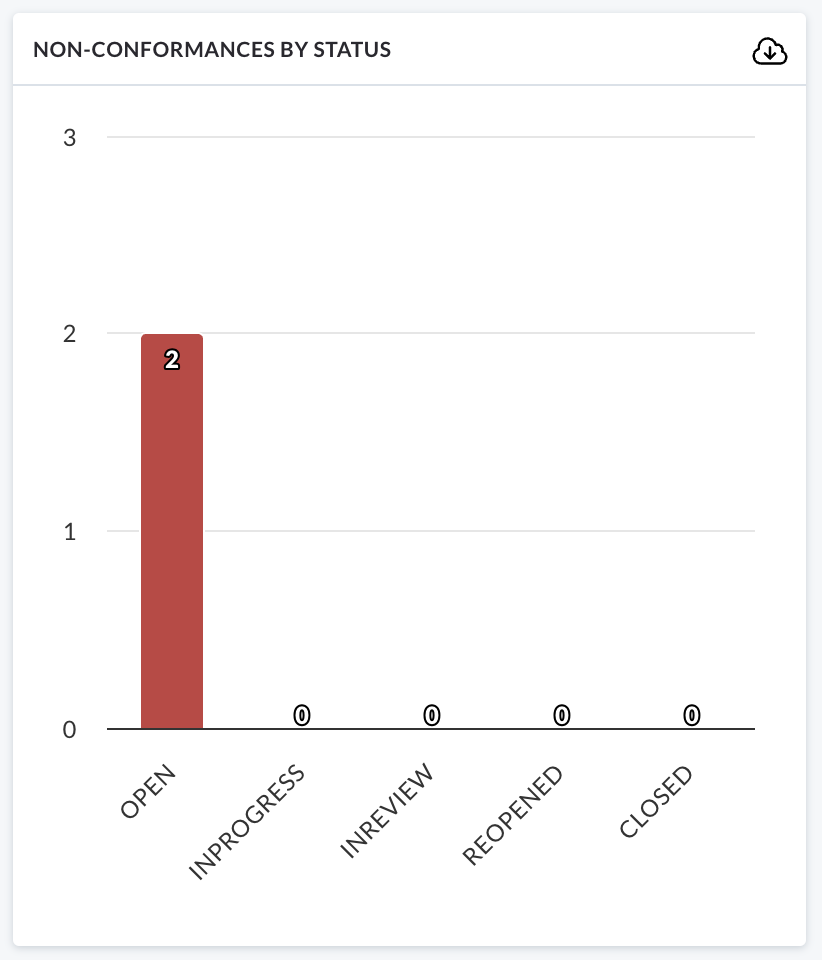
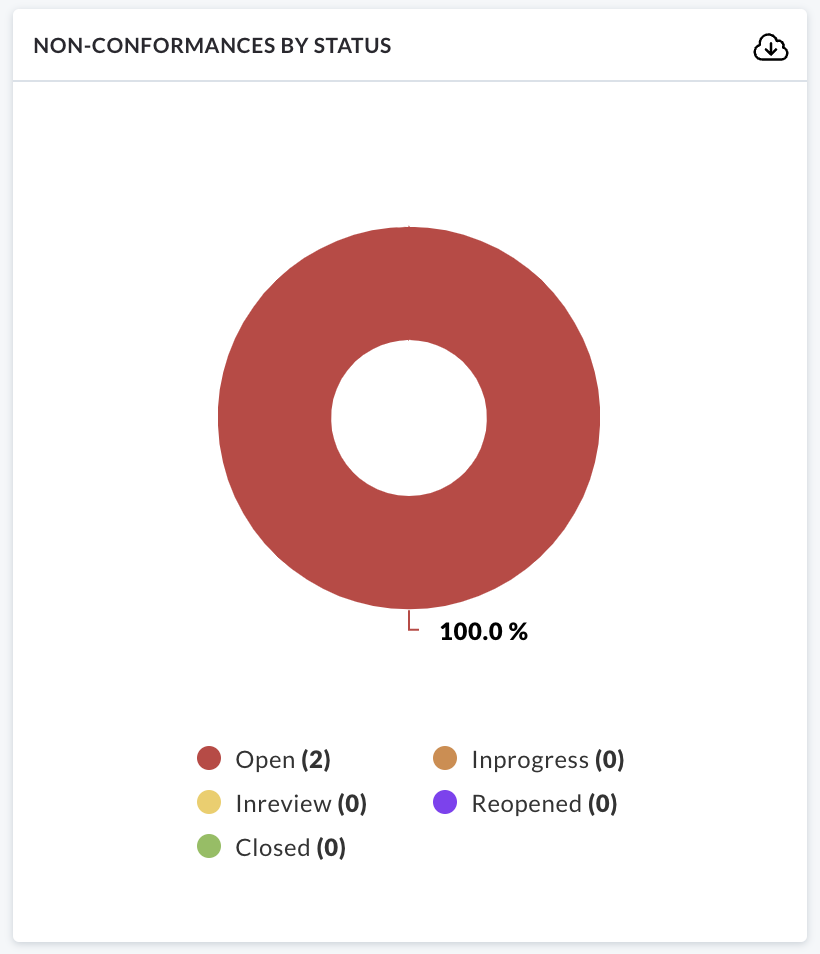
- Non-Comformances by Status: Displays information in both pie and bar chart formats.
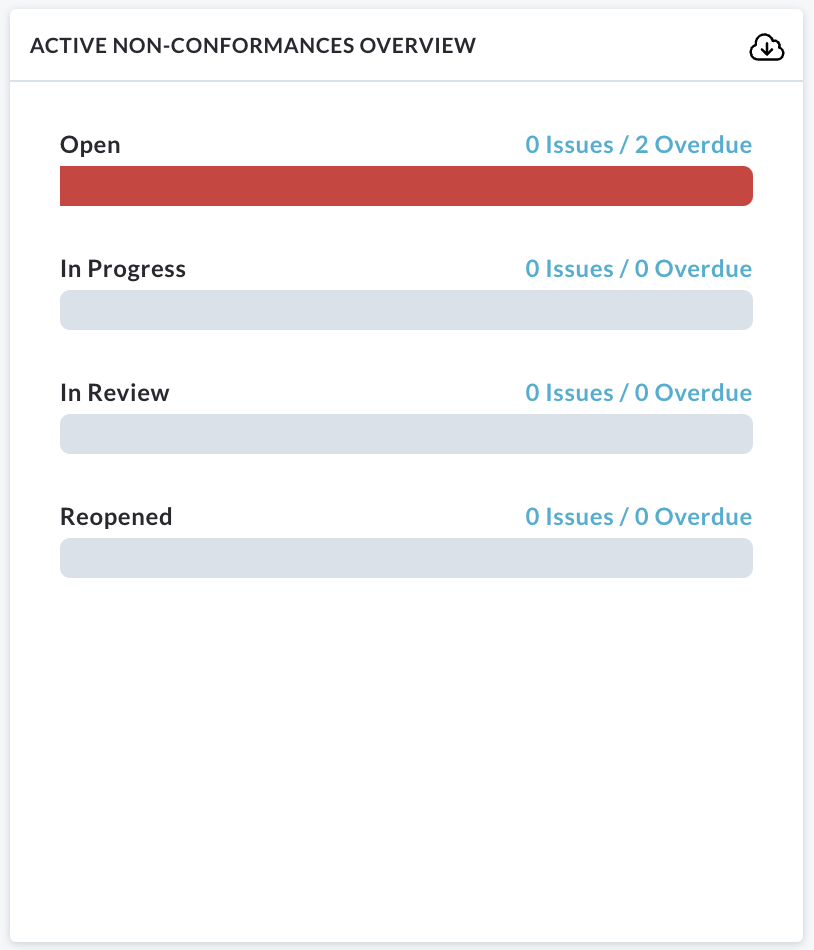
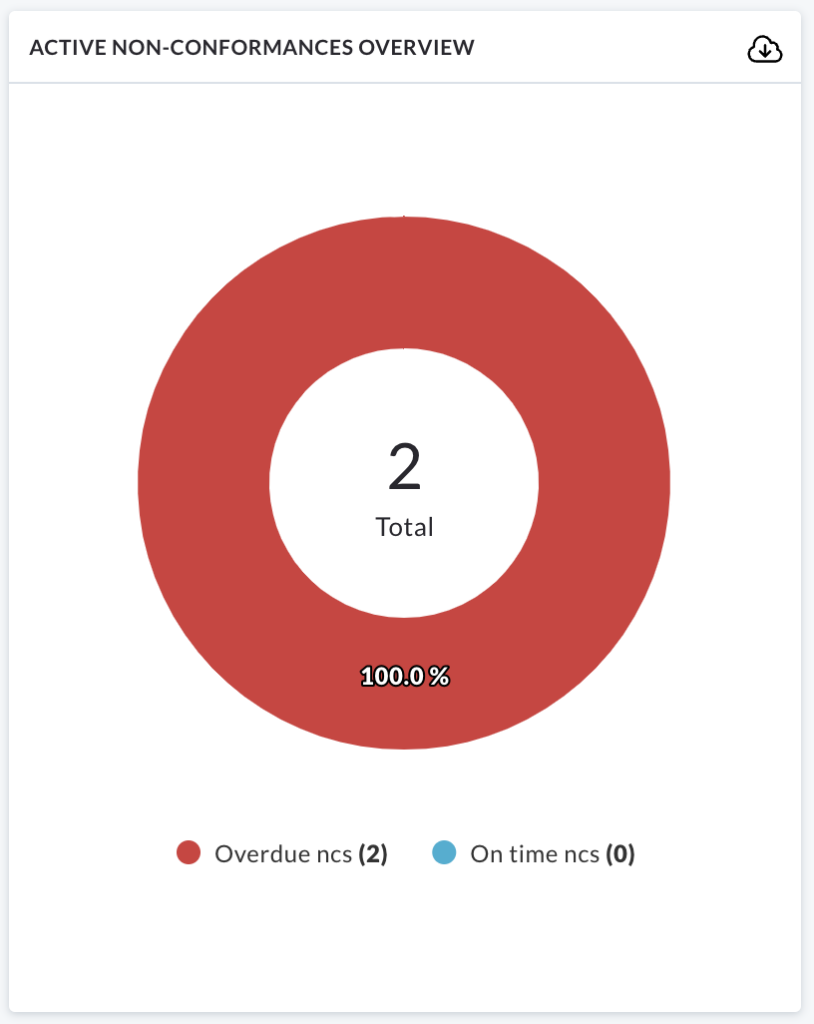
- Active Non-Conformances Overview: presents information in list form and as a pie chart.
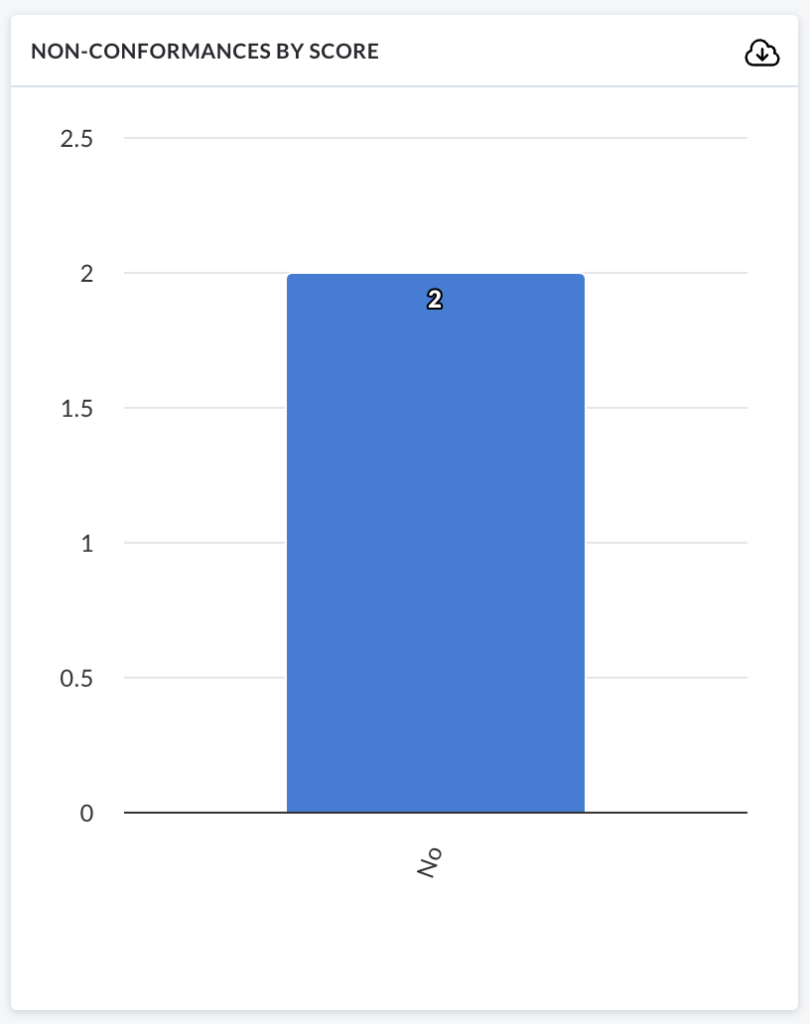
- Non-Conformances by Score
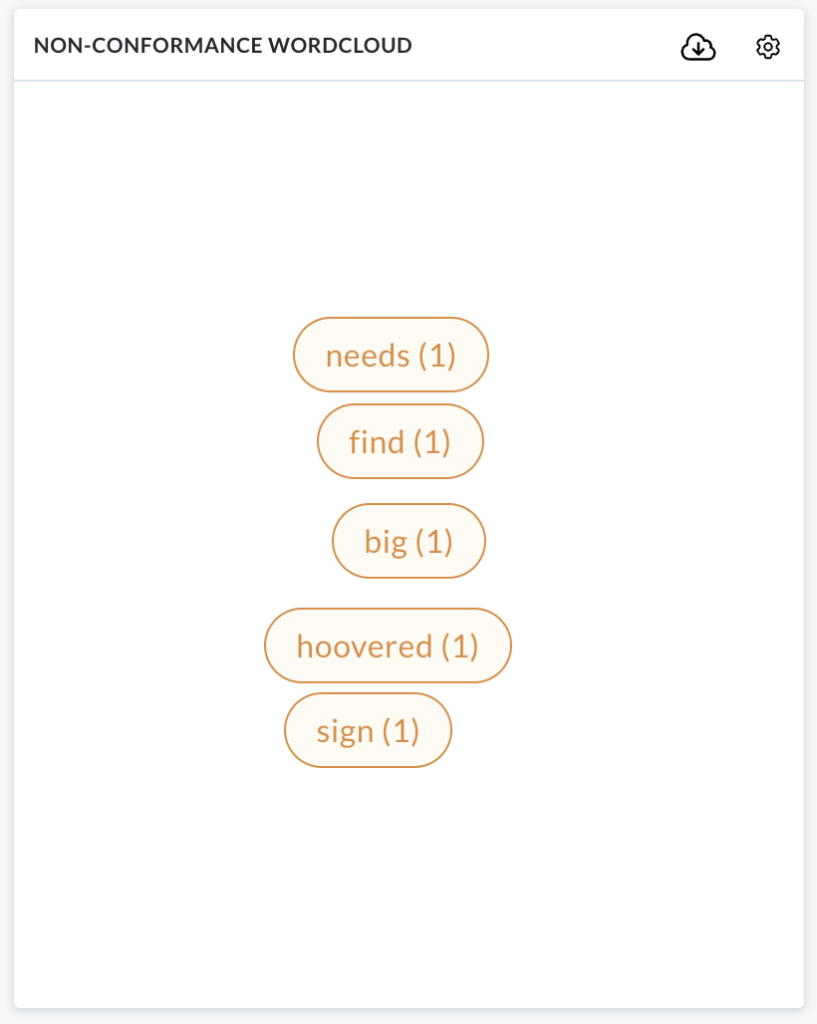
- Non-Conformance Word Cloud: Highlights common issues and threats identified in completed audits. The size of each word in the cloud reflects the frequency and potential severity of the issue.
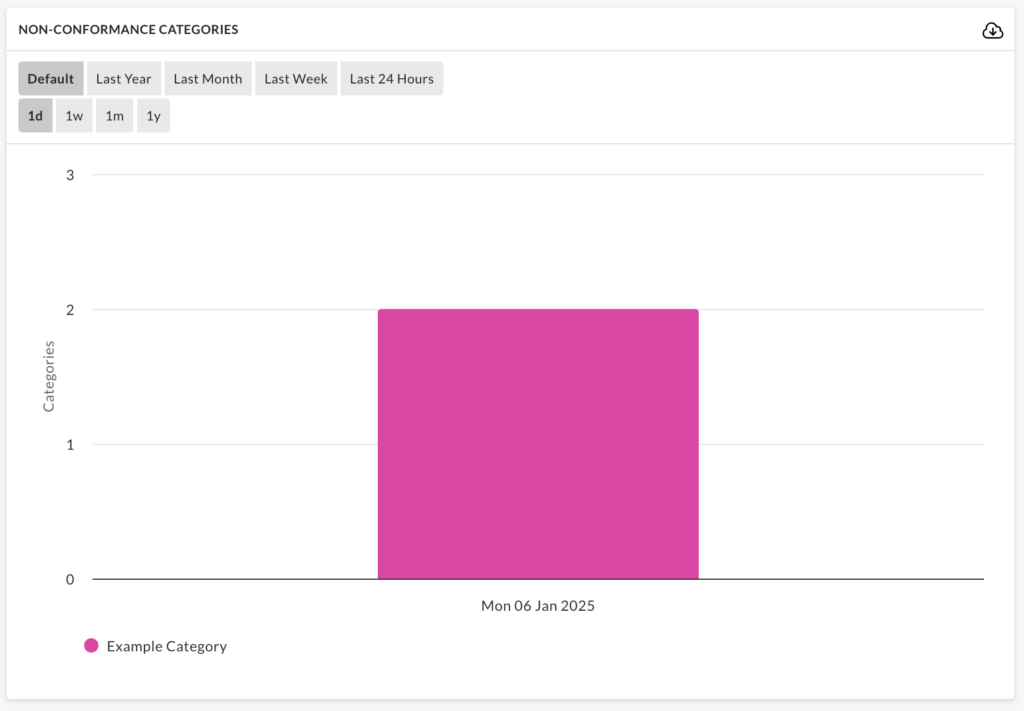
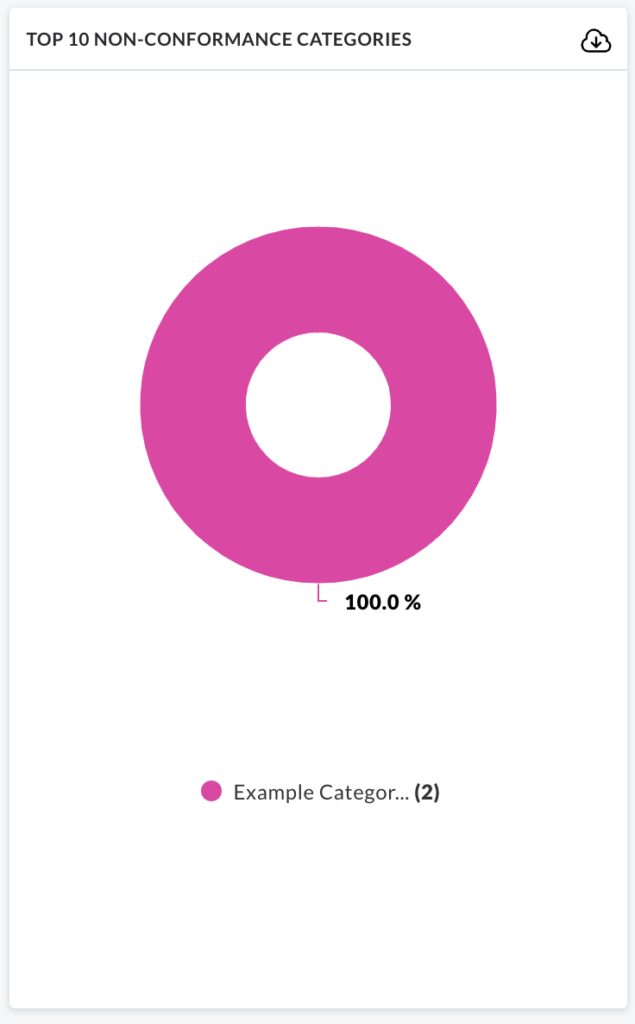
- Non-Conformance Categories/ Top 10 Categories: Represented in both bar and pie chart formats.
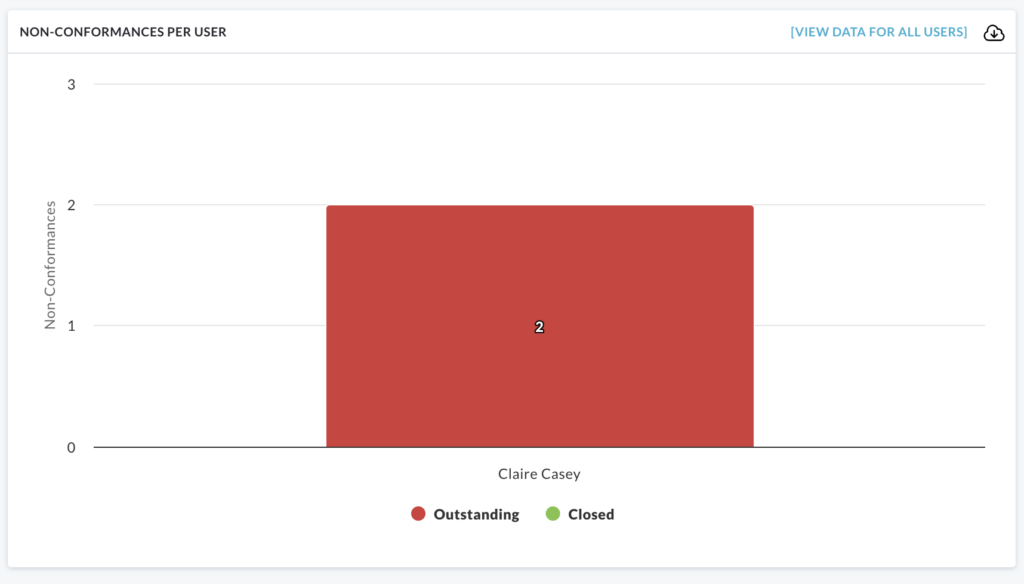
- Non-Conformance by User: Displays the total number of outstanding and closed audits for selected users in bar chart format.
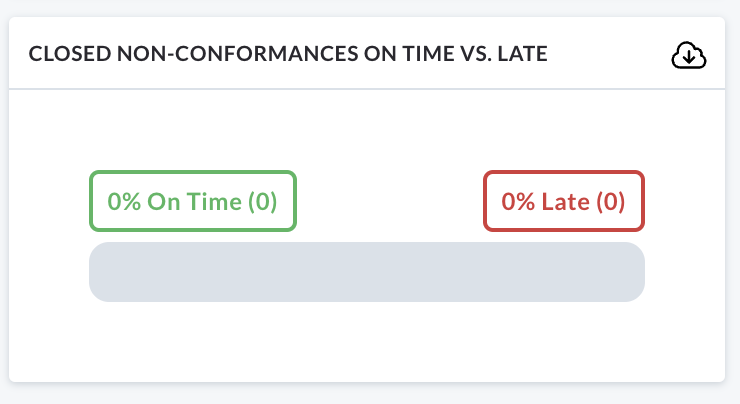
- Closed Non-Conformances On Time Vs Late
All individual charts can be downloaded by clicking on the cloud icon on the right side of each chart.
Chart Interaction
Charts can also be interacted with for further details.
We will use the Non-Conformances by Status barchart as an example.
Hover over the red area of the bar chart:
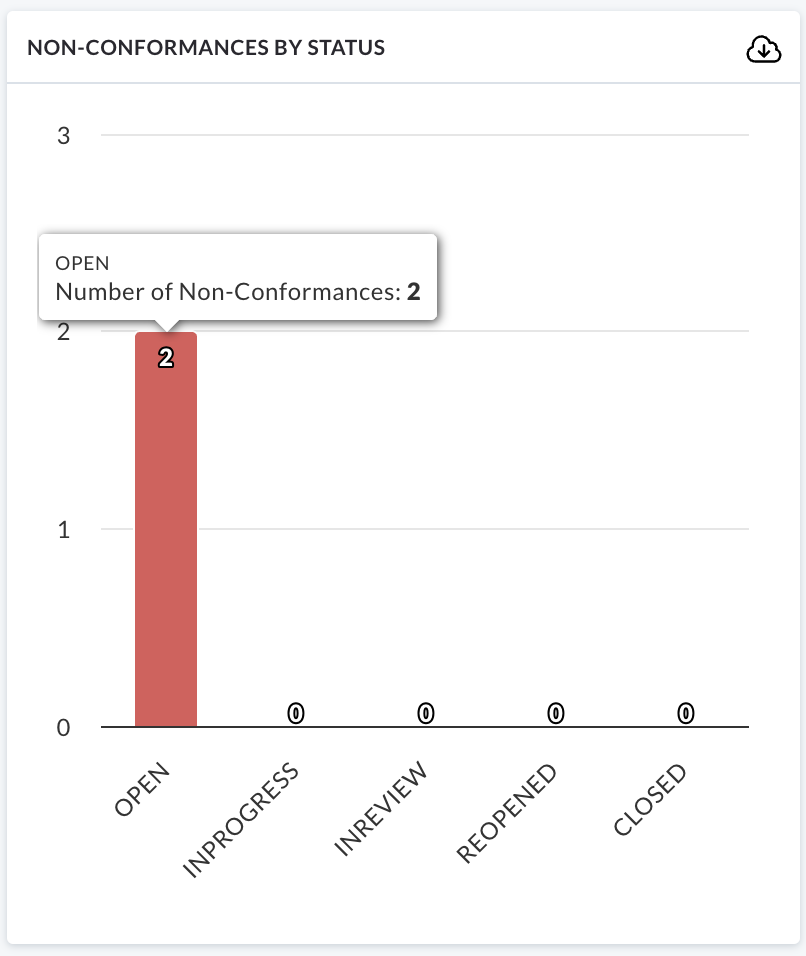
Clicking on this area will direct you to a list of audits with currently open non-conformances.
This interactive exploration applies to all charts in this section, with the exception of Closed Non-Conformances On Time Vs Late.