
The Task Analytics page offers a visual summary of non-conformance data.
It is located within the second tab within Reports > Task.
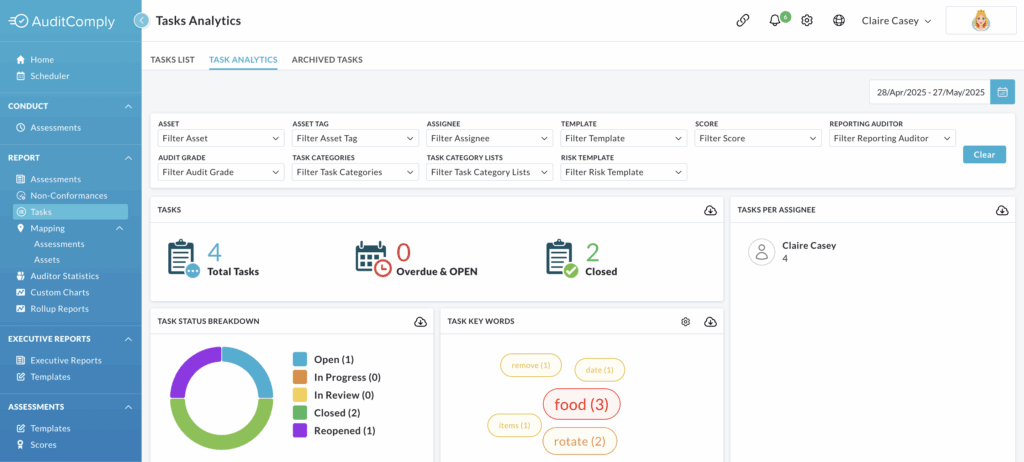
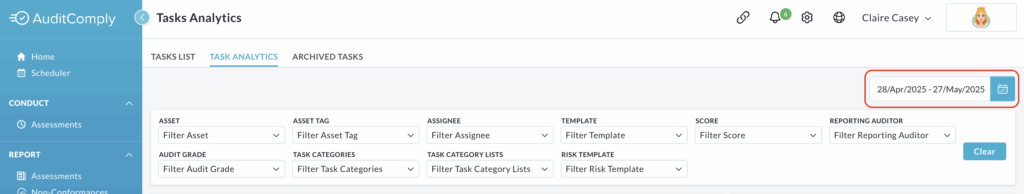
By default, it displays information from the previous calendar month.
To modify the displayed timeframe, click the calendar icon located next to the date range.
This will present a selection of predefined date filters for quick selection.
Alternatively, you can manually choose a custom start and end date using the interactive calendars provided.
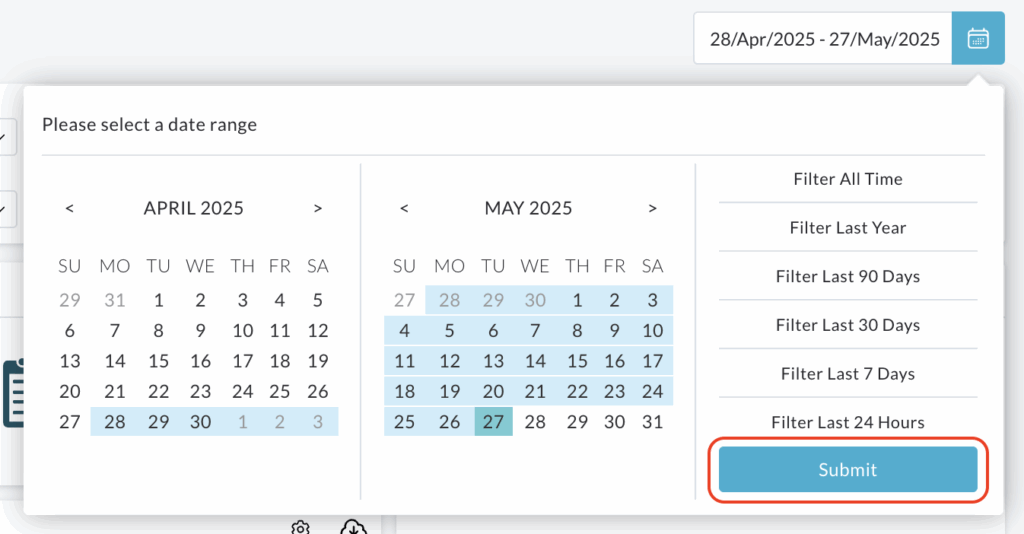
After selecting your desired date range, click the Submit button to refresh the analytics displayed on the page.
All the information presented on the Task Analytics page is interactive, allowing you to delve deeper into the data.
Tasks
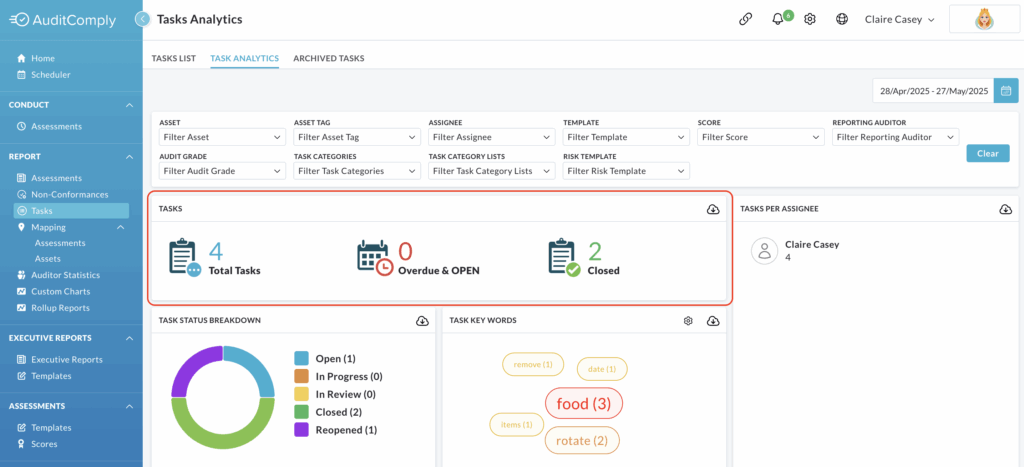
This section provides a breakdown of the total number of tasks raised within the selected date range, categorized as:
- Total Tasks: The overall number of tasks recorded.
- Overdue & Open: The number of tasks that are both past their due date and still open.
- Closed: The number of tasks that have been closed.
Clicking on the numerical value displayed next to each of these task categories will automatically open the Task List.
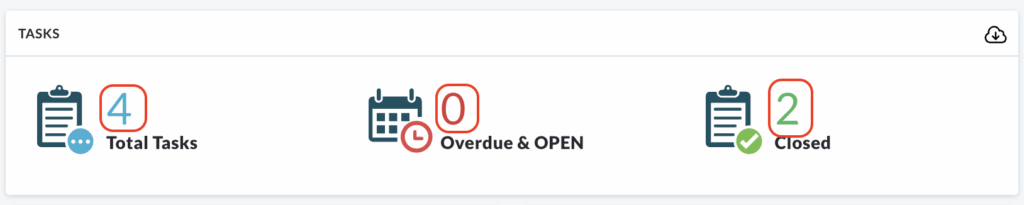
The list will be pre-filtered to show only the tasks corresponding to the category you clicked on (e.g. clicking on the number beside Overdue and Open will display a list of overdue and open tasks).
Tasks Per Assignee
This section presents a list of users and the corresponding number of tasks that have been assigned to each of them within the selected date range.
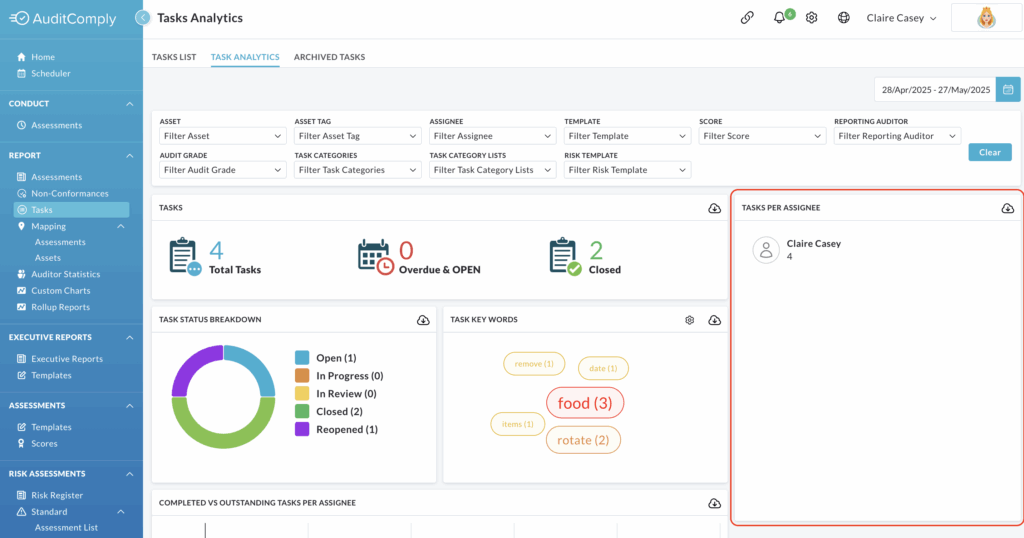
Clicking on the name of a specific user will navigate you to the Task List.
This list will be automatically filtered to show only the tasks that are currently assigned to the user you clicked on.
Task Status Breakdown
This section displays a visual chart illustrating the distribution of tasks based on their current status within the applied date range (e.g. Open, In Progress, In Review, Closed, Reopened).
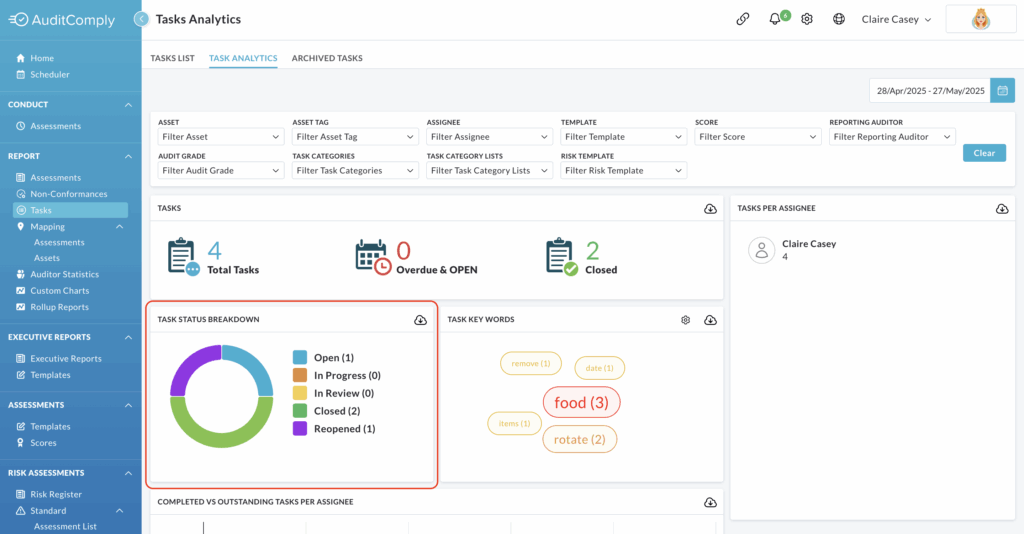
The information in the chart is displayed in percentage format, indicating the proportion of tasks that fall into each section.
Hovering your mouse cursor over a specific section of the chart will display the exact percentage for that status.
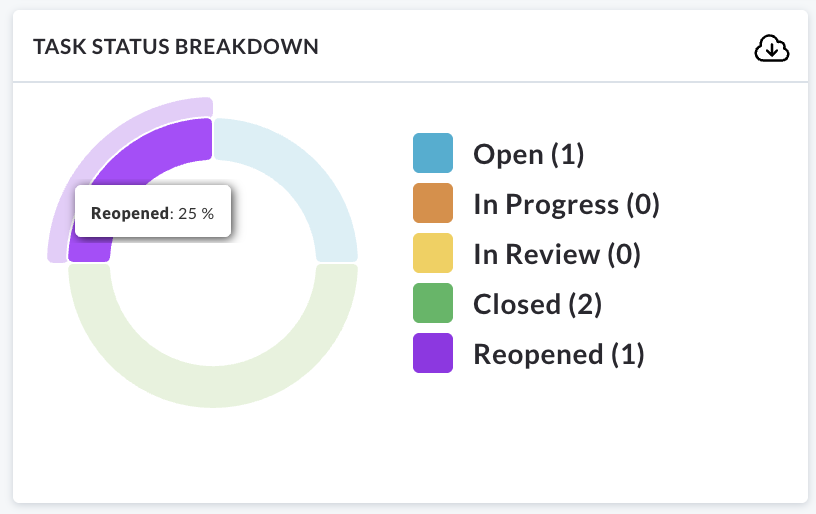
Each section of the status breakdown chart is interactive.
Clicking on a particular status segment (e.g. the section representing Reopened tasks) will take you directly to the Task List. The list will be automatically filtered to display only the tasks that have the status corresponding to the chart section you clicked.
Task Key Words
The Task Key Words word cloud is a visual representation of the keywords that appear most frequently in the descriptions or details of recorded tasks within the selected date range.
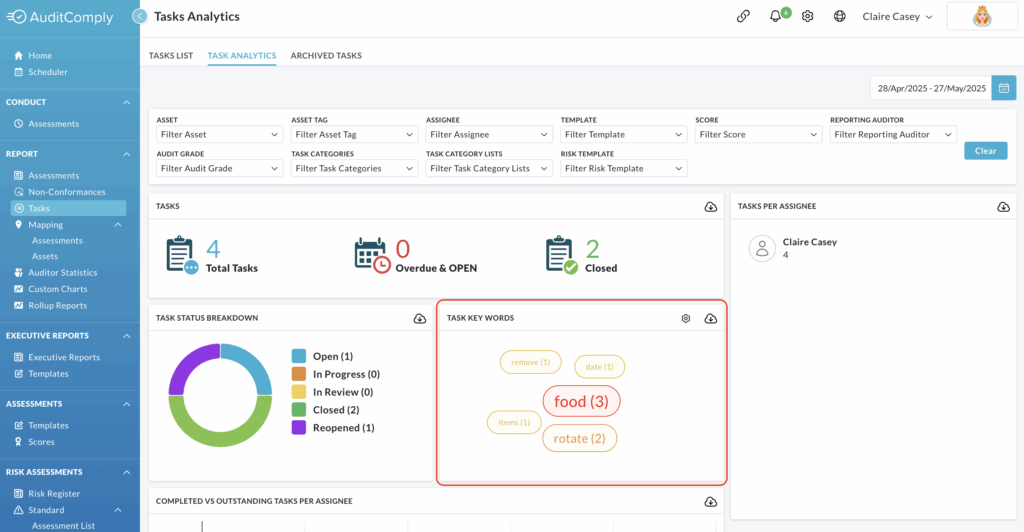
The size of each word in the cloud is directly proportional to its frequency of use. Larger words indicate that those terms have been used more often when documenting tasks.
Each word within the word cloud is interactive.
Clicking on a specific keyword will navigate you to the Task List. This list will be automatically filtered to display only those tasks that contain the keyword you selected in their description.
Located within this section is a Setting icon.
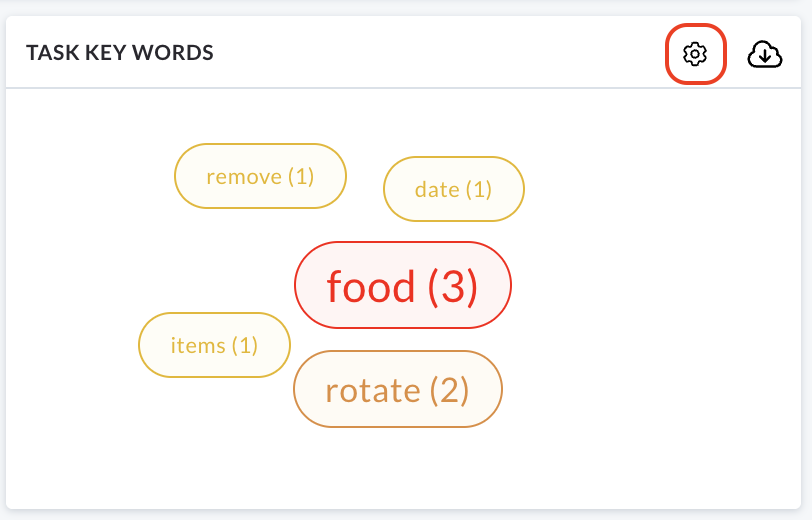
Clicking on this Settings icon will take you away from the Tasks Analytics page and directly to the Report Setting section of your Administration Panel.
Within Report Settings you will have the ability to manage the words that appear in the Tasks Key Words Cloud. This includes options to add or remove specific key words.
Completed Vs Outstanding Tasks Per Assignee
This visual representation uses a bar chart to compare the number of completed and outstanding tasks for each user that has been assigned responsibility for addressing them.
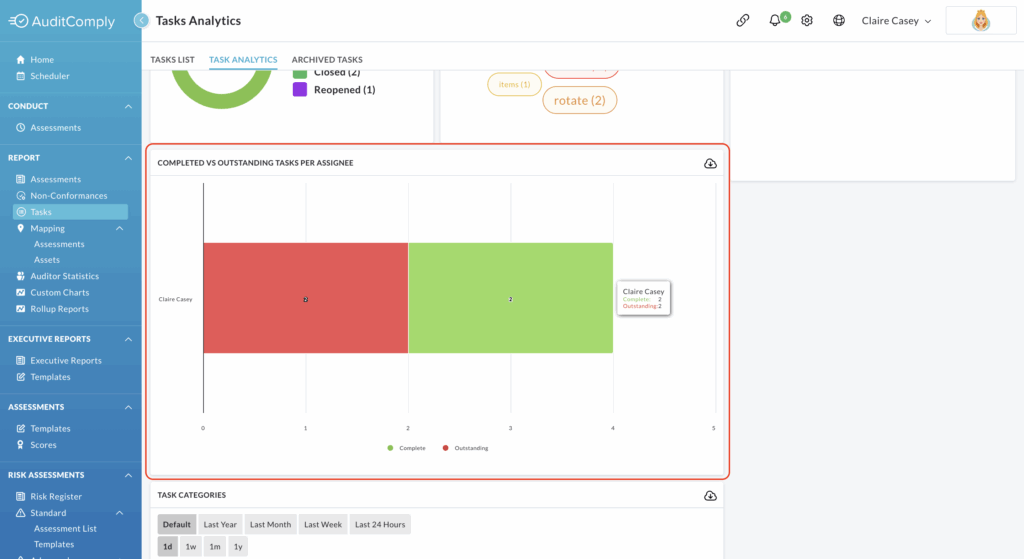
The data presented is within the selected date range.
The chart uses a consistent colour scheme to differentiate between the statuses:
- Green: Represents the number of tasks assigned to a user that have been completed.
- Red: Represents the number of tasks that are still outstanding (not closed).
Each individual user with assigned tasks has their own distinct section within the bar chart, allowing for clear comparison of their completed versus outstanding tasks.
The different coloured sections within each users bar are interactive.
Clicking on a specific section will navigate you to the Task List, filtered according to the information represented by that section.
For example, clicking the green (completed) section for a specific user will display the Task List showing only the tasks that were assigned to that user and have been marked as completed within the selected date range.
Clicking the red (outstanding) section for a specific user will display the Task List that are currently assigned to that user and are still outstanding within the selected date range.
