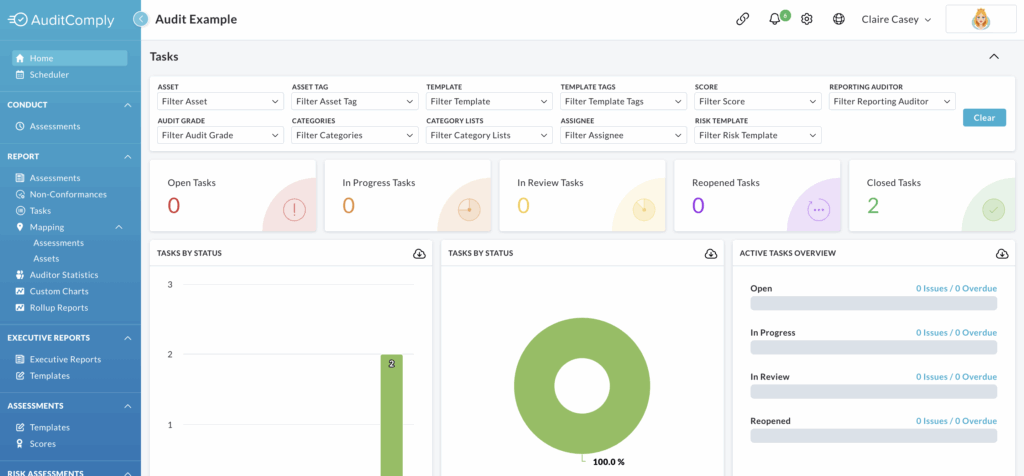
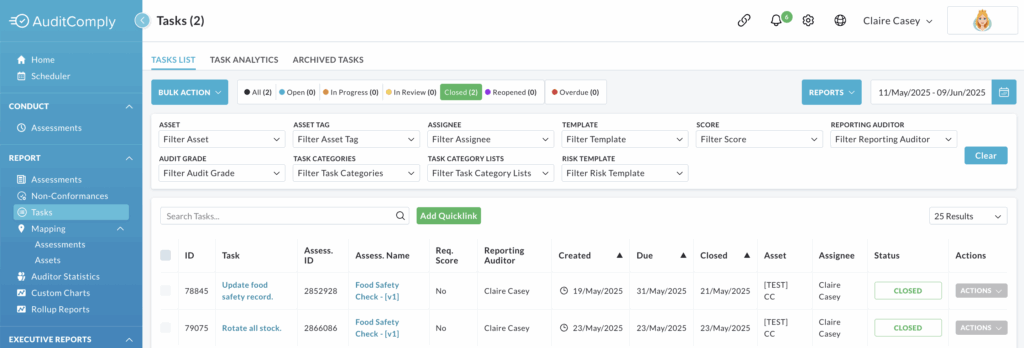
This section presents tasks created to address any non-conformances identified following an audit.
Filtering Tasks
A variety of filters at the top of the section allow you to refine the displayed information.
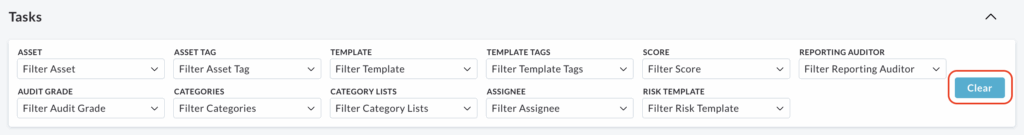
To return the filters to the default settings, click Clear.
Task Charts
Below the filters, you’ll find a summary of Task data based on the applied filters. For more in-depth information, click on the desired section.

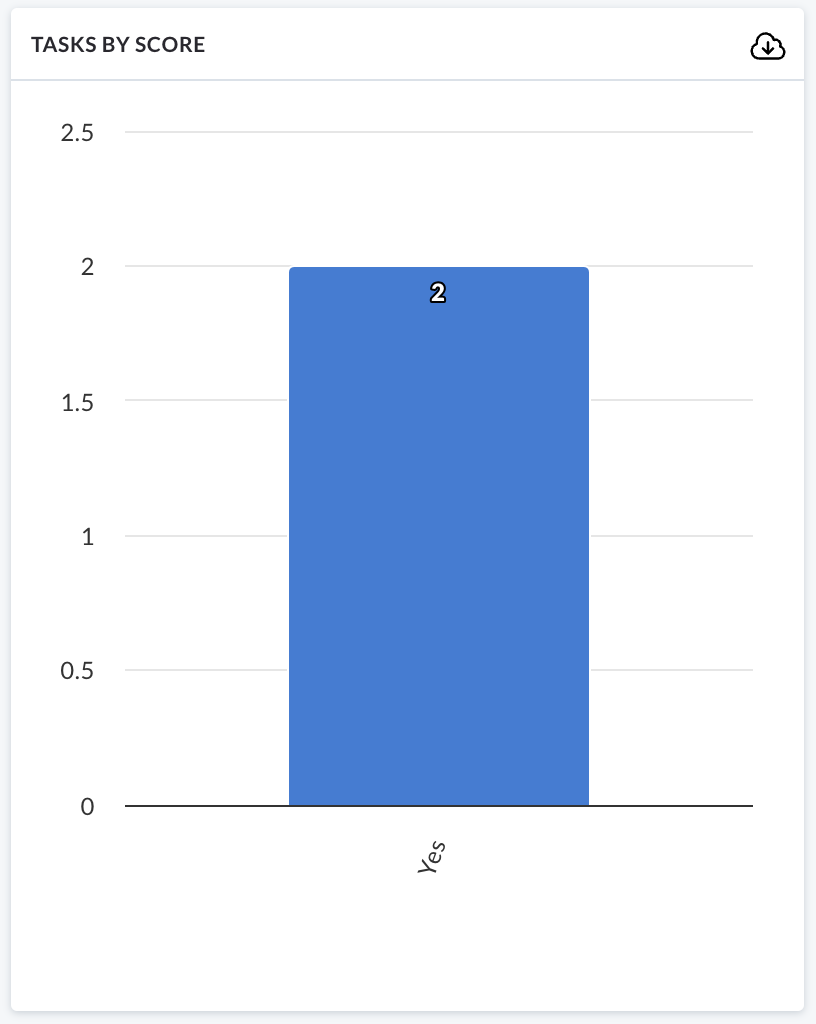
A variety of charts and graphs provide Task information in several ways:
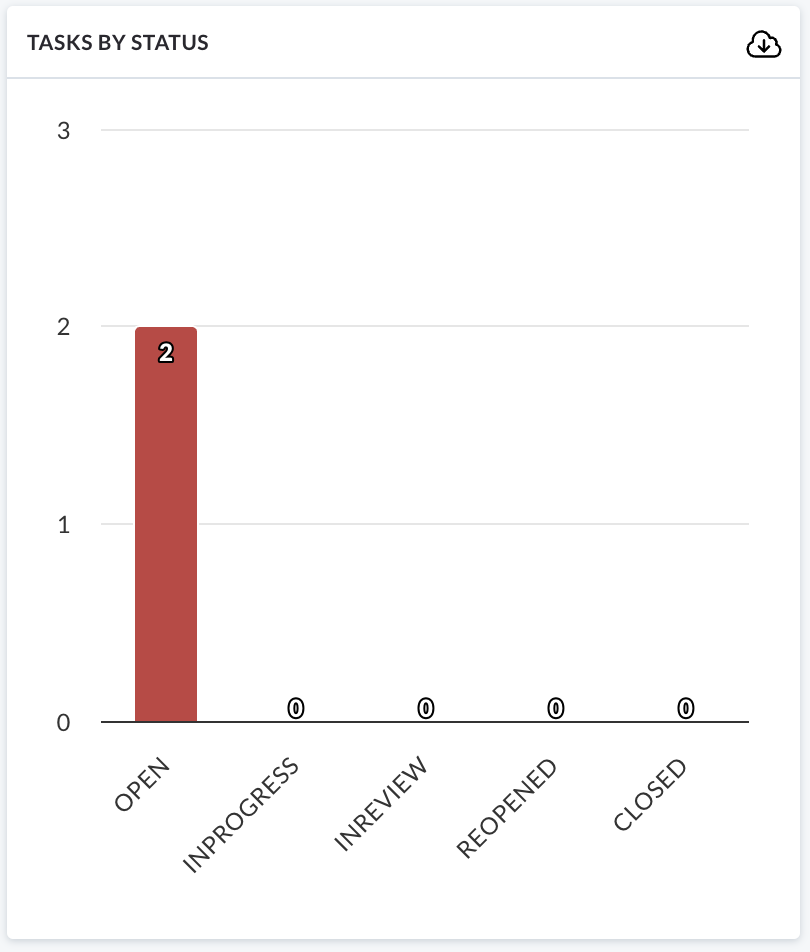
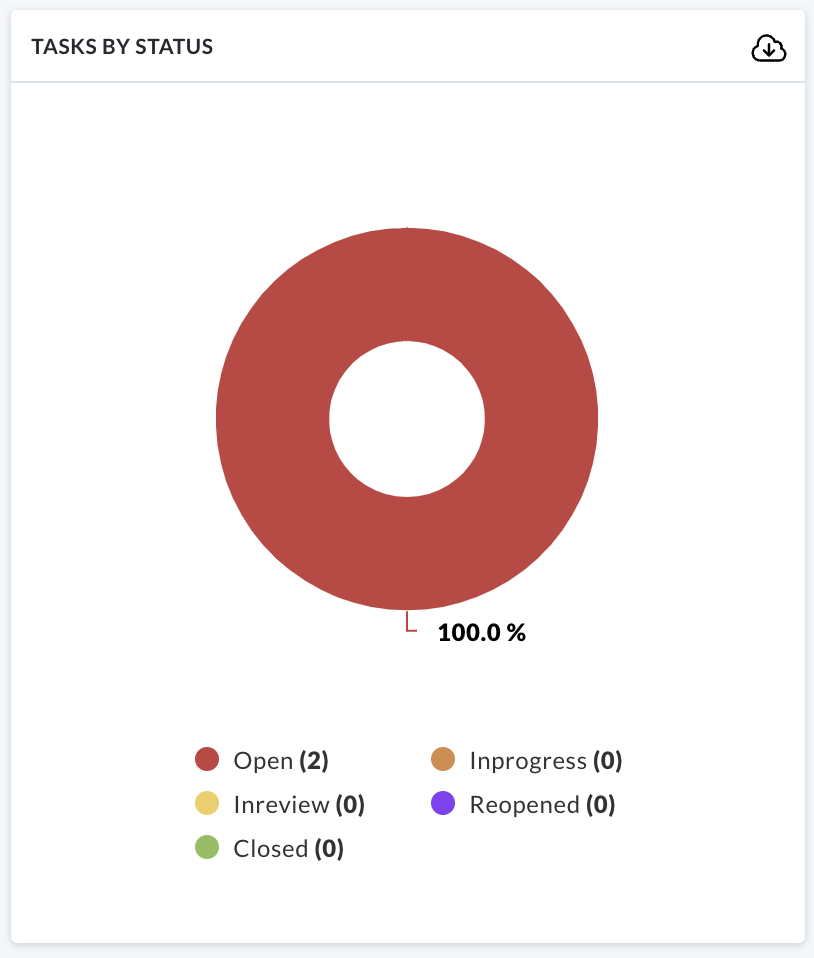
- Tasks by Status: displayed in both bar and pie chart
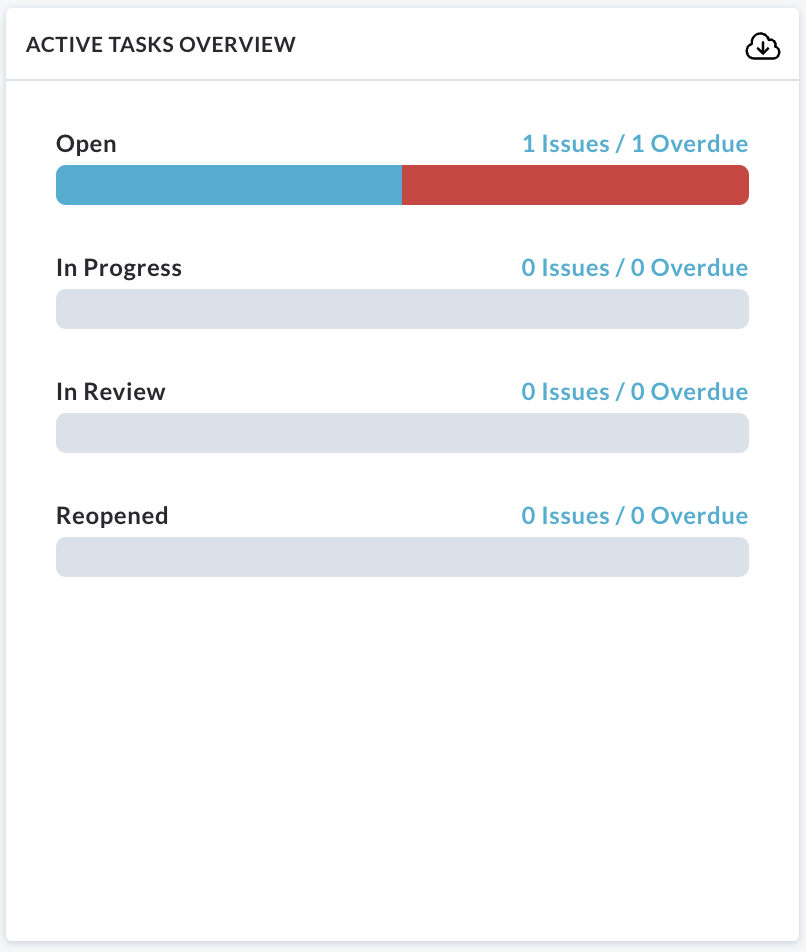
- Active Tasks Overview: in both bar and pie chart
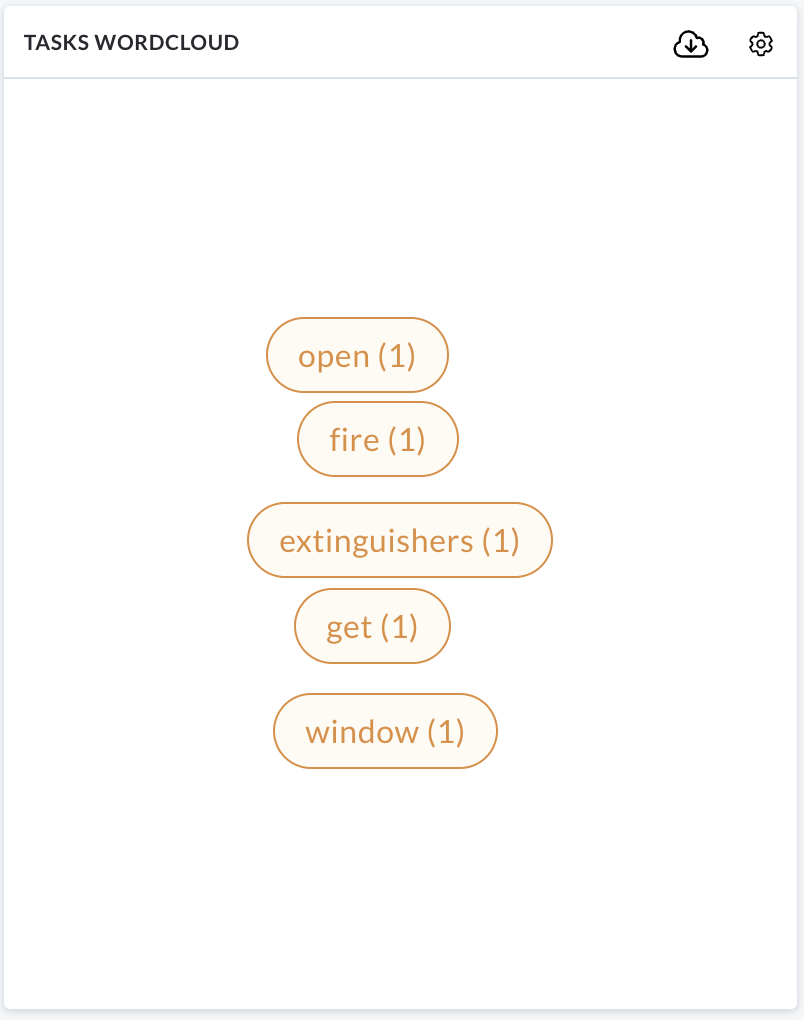
- Task Word Cloud
- Task Categories
- Top 10 Task Categories
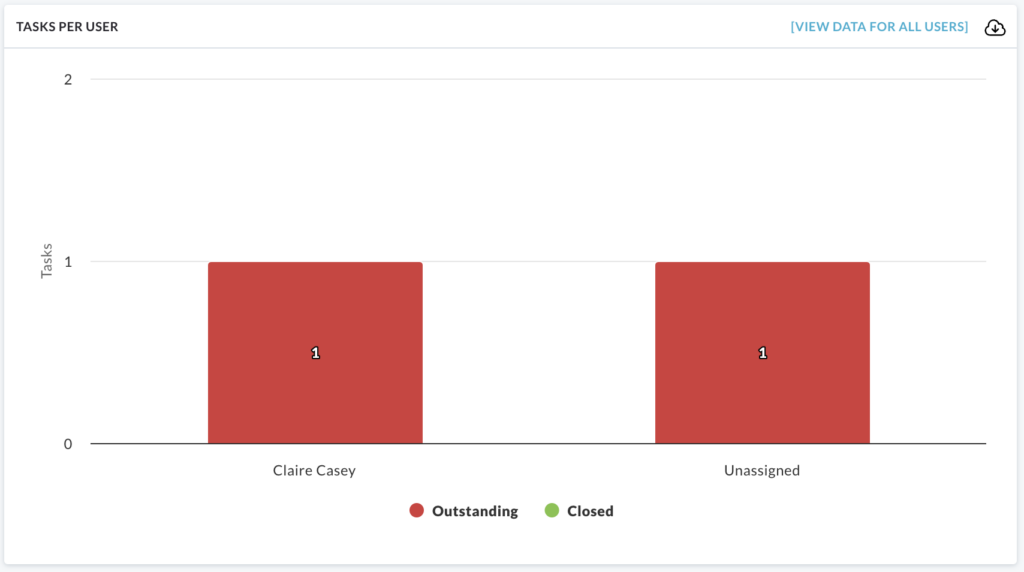
- Tasks by User
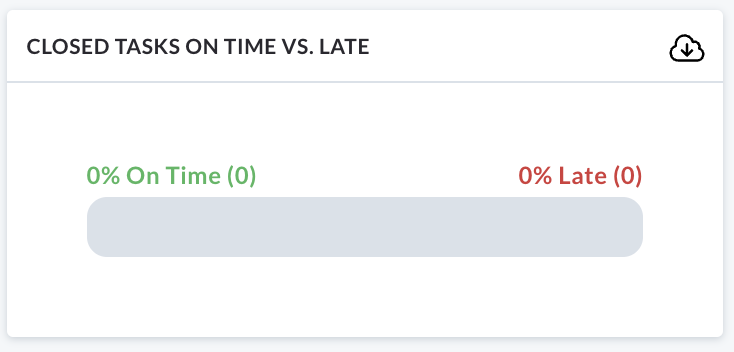
- Closed Tasks on Time vs. Late
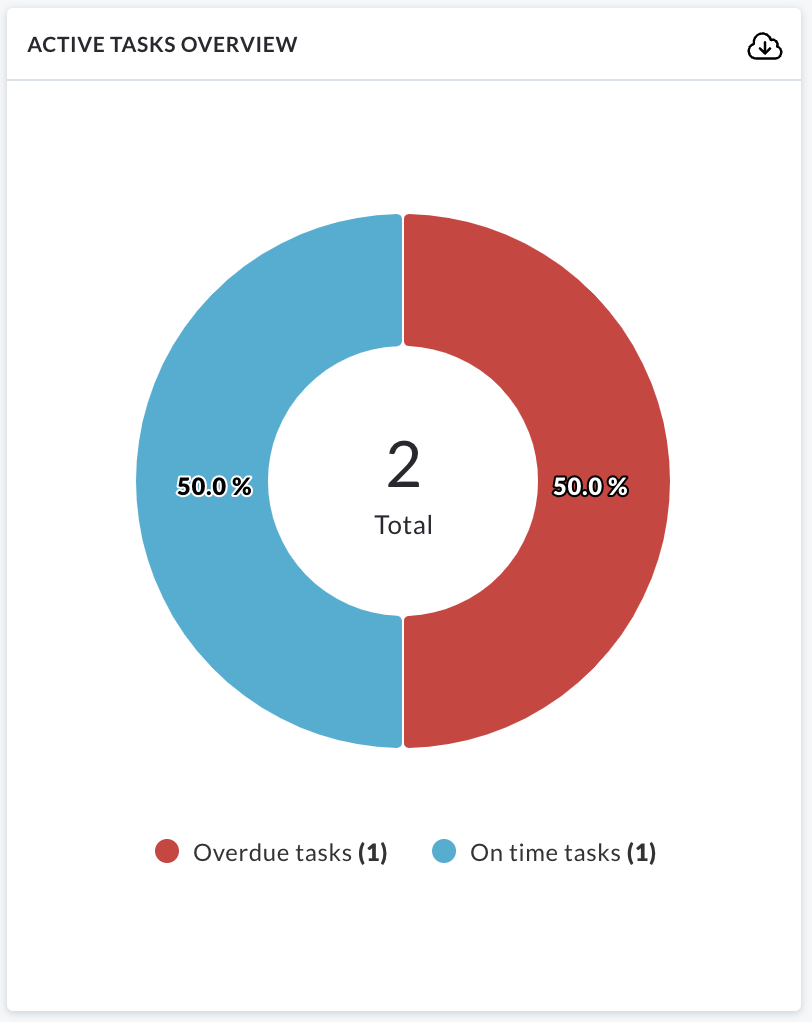
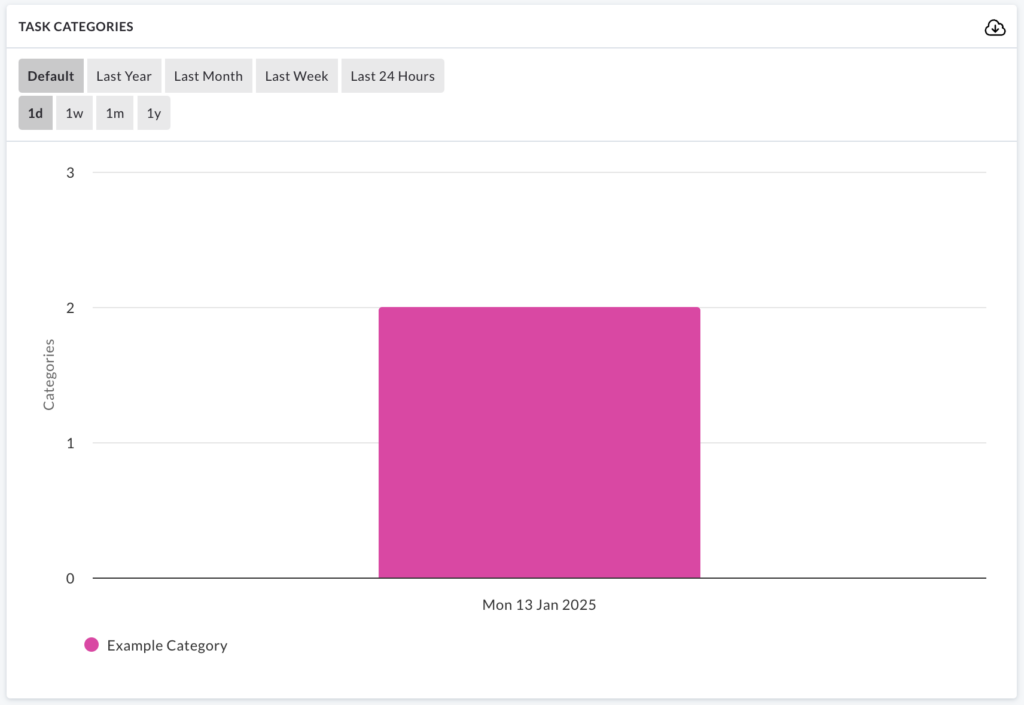
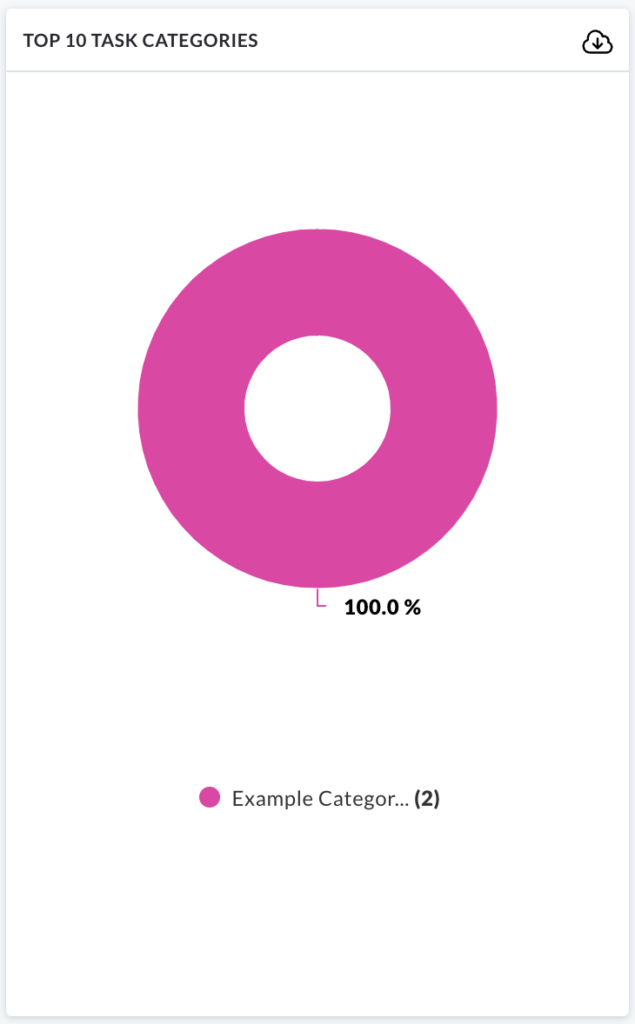
All charts in this section can be downloaded by clicking on the cloud icon on the right side of the chart.
Exploring Charts
You can explore the charts further by hovering over specific areas.
Lets use the Tasks by Status chart as an example.
Hover over the red Open area of the bar chart:
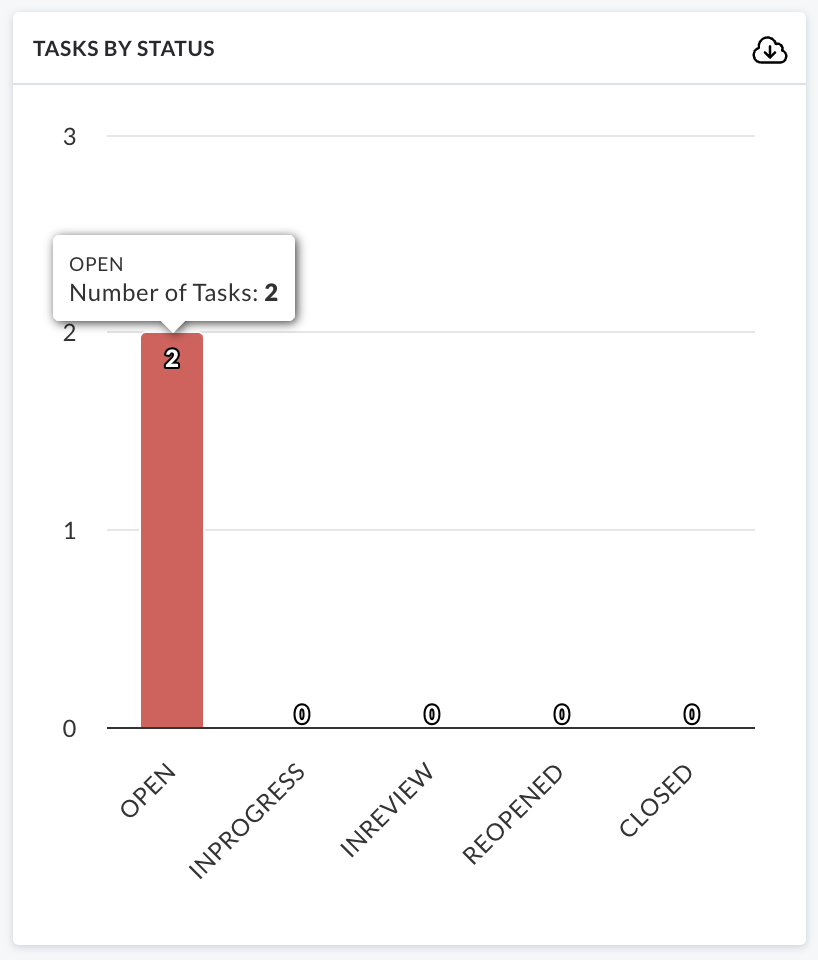
Clicking on this area will direct you to a list of Tasks currently open and awaiting action.
This approach can be applied to all charts in this section, with the exception of Closed Tasks On Time vs Late.